Join River Justice for a Truckee River Riparian Ecosystem Workshop
Diversity and River Functions are Key
Our work with River Justice continues to help focus on the diversity on the river. This will overall benefit riparian functions, bring improvements to water qualitv and protections to fish habitat.
In this workshop, you will learn about the historical impacts of river projects. You will also understand the threats to LCT and the Kooyooe, Truckee River flow management, data center threats to watershed, bird surveys, solid waste pollution, decreasing cottonwood canopy, bird response to riparian recovery, and river flows influencing cottonwood growth.
A vibrant, multi-paneled mural displaying Native American’s deep ancestral connection to the Truckee River, Pyramid Lake, and Lake Tahoe now greet students, visitors, and faculty on the UNR campus. Envisioned and created by Pyramid Lake Tribal member Autumn Harry over a couple of months and dedicated in mid-September 2024, the panels capture the spirit found in the four tribes: NUMU, WÁ-SIW, NEWE, and NUWU.
Located just north of the UNR Quad between the Pennington Student Achievement Center and the Ansari Business Building.
Autumn’s work was selected out of several mural proposals.
One of the four panels depicting Indigenous people’s connection to Pyramid Lake and its Cui Ui and Cutthroat Trout
The timing between rainfall events stresses plants throughout the region. The decrease in moisture leads to more intense fires and dried up vegetation needed for wildlife and agriculture alike.
The research was led by University of Arizona climate scientist Fangyue Zhang. The reduction in drought busting rainfall across the southwest is consistent with climate models forecasting decreased moisture as the overall atmosphere warms due to human-caused greenhouse gas increases.
“Human activity is driving climate change.” said Colm Sweeney of NOAA’s Global Monitoring Laboratory this Wednesday according to an article in the USA Today which continued: “…the level of carbon dioxide (CO2) in the Earth’s atmosphere is now higher than it has been in at least 3.6 million years.”
Droughts appear to be lasting longer as the active winter pattern of Pacific storms shift north more frequently. This year in California and western Nevada, only one significant storm in January upped the percentage of the meager snowpack. Ultimately, the snowpack topped out around 68% for the Tahoe-Truckee River by April 1, but runoff will be less than 40% of the average due to the extremely dry soils throughout the Sierra and Nevada.
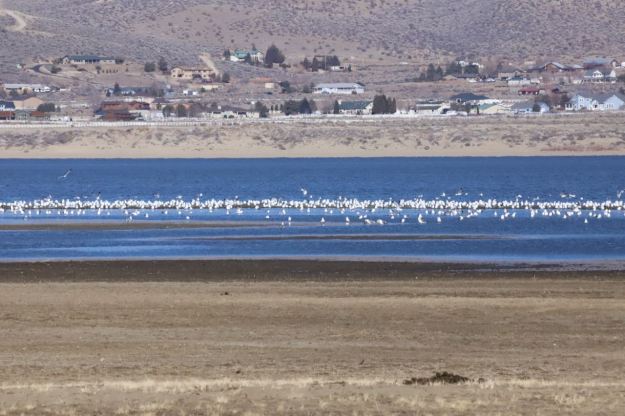
Gulls crowd a recently exposed sandbar in shrinking Washoe Lake.
Plastic water-filled bottles are everywhere. They line grocery and convenience store isles and wait for you at checkout stands. From ski hills to ocean beaches to executive board rooms, people haul around their no-calorie elixir wrapped in plastic. The stats tell us just how addicted we are to our bottled ounces of the essential liquid in shiny clear plastic containers wrapped helpfully with plastic brand labels – DaSani™, Aquafina™, Fiji™, Evian™, Nestle™, etc. According to a recent analysis in Consumer Reports (https://www.consumerreports.org), water bottled in plastic containers is the #1 consumer beverage – 42 gallons per average American a year or 336 sixteen ounce bottles – at an annual consumer cost of $31 billion and growing.
Why would the average American spend hundreds of dollars for water when it is available at the tap for just pennies? Many people say it is convenience, but 40% of Americans believe that water bottled in plastic is “safer than tap” according to CR. Some of that concern comes from the nationally reported lead-contamination in Flint, Michigan in 2014. Flint, however, is an extreme exception and not the rule. Ninety percent of Americans get their water from municipal suppliers who provide their customers with exceptionally high quality water mandated by drinking water standards set by Federal and state laws. Those municipal suppliers (like TMWA and the Las Vegas Valley Water District) “have no reported health-based quality violations” according to the EPA as reported by CR.
TMWA’s Chalk Bluff Water Treatment Facility can treat 90 million gallons of water a day.
That’s good news for bottled water buyers because 64% of the water sold in plastic containers comes from municipal water systems across the country. Drinking water standards for municipal supply are part of federal law and you can check the quality of your municipal supplied water in annual reports*. Drinking your 8 glasses of clean water a day needn’t include creating plastic waste. Drinking your 8 glasses of clean water a day needn’t include creating plastic waste.
The US Food and Drug Administration does inspect bottling facilities and requires quality testing by the company selling water in plastic containers. However, the water in plastic doesn’t have water quality standards in federal law and the FDA isn’t required to conduct its own water quality tests. And, there are concerns about the plastic container itself potentially contaminating the water – either prior to sale or afterward once purchased by the consumer.
Its such a waste …
What happens to all those plastic bottles emptied of their water? Unlike an aluminum can that can be recycled indefinitely into another can, plastic water bottles cannot be recycled into more plastic water bottles. Rather, recycled plastic bottles are mostly used for some other “down-cycle” product – like a plastic bag or pen¹. Inevitably, though, nearly all plastic ends up in a land fill (a better outcome) or finds its way into a water body near you. As consumers, we need to kick the plastic water bottle habit to help minimize the impact on the environment from plastic waste.
Plastic bottles and other plastic too often ends up in our rivers, lakes and oceans. Plastic gradually breaks down, but never goes away. Instead, plastic breaks up into pieces that get smaller and smaller over time eventually forming micro plastics that can be ingested by fish and other wildlife (humans too!). The problems created by discarded plastic containers extends beyond the ocean and also threatens water quality in lakes and rivers. Micro plastic has been found in Lake Tahoe2.
So, what is a consumer trying to cut down on plastic going to land fills – or worse to the rivers and lakes and oceans – to do? Yup, buy a non-plastic container for water that you can fill from the tap and use that. Keep one in your car, your pack, and for your bike. Cutting out plastic water bottles makes both environmental and economic sense.
In Nevada, as in many other western states, those who first put water to beneficial use (growing a crop or providing drinking water to a town, for example) have a right to use that water over those who come later. Early on most water used in the state came from surface waters such as the Truckee or Humboldt Rivers or smaller streams which flowed from the state’s numerous mountain ranges or from local or large regional springs. Most of the surface waters in Nevada were already claimed before the 1930s. The beneficial uses claimed became water rights. Water rights can be bought and sold.
Native Americans were already here.
Sketch of the Pyramid from Fremont’s Report on surveys in Nevada and California (1844)
Ignored in the claiming of water rights beginning in the late 1850s was the cyclic nature of water availability in the dry Great Basin and Mojave Deserts. Water that is present in a sagebrush covered valley one year may be absent the next one or longer. And while the newcomers claimed the water for themselves, none appeared to notice that the Paiute, Shoshone, and Washoe Peoples already occupied the land and were prior users of the rivers and springs that nourished many wetlands, lakes, and meadows with the wildlife and plants the People depended on for survival. The Indigenous population found that the water that supported their way-of-life for thousands of years was used somewhere else by someone else. The water supplied by the natural world that had sustained them disappeared.
Newcomers claim the water.
Native American Petroglyph
Over the decades more and more water claims depleted rivers, lakes, springs, and wetlands throughout the state. Lakes such as Pyramid fed by the Truckee River and Walker fed by its namesake shrank as their river’s flows diminished – or disappeared altogether. And large wetlands on the Humboldt and Carson Rivers shrank as water went to farms and industry.
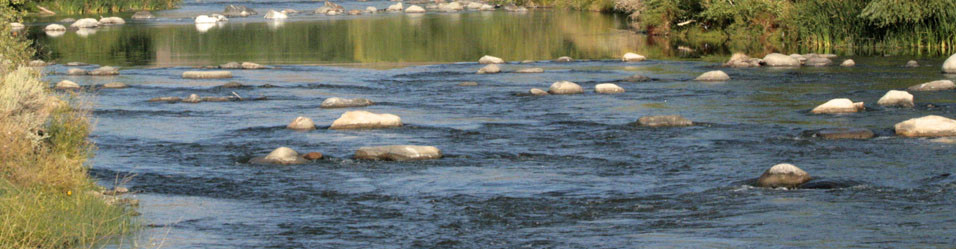
Long stretches of dry winters result in only a trickle in the Truckee River through Reno. Water rights diversion remove most of the small flow that remains.
Taking water flowing in a river, stream, or spring has an immediate effect. For example, consider a small stream that has a flow of 10 cubic-feet per second (CFS)† with two users who each claim 5 CFS. If water user number 1 diverts half of the flow of the stream to an irrigation ditch, then the flow downstream of the diversion is immediately reduced to 5 CFS. The remaining water in the stream continues downstream to water user number 2. When water user number 2 diverts his share, then downstream of the diversion, the stream is dry. In a different year or later in the season, when the stream’s flow is 5 CFS, then water user number 1 diverts all flow and nothing remains for water user number 2. When the stream has 1 CFS, water user number 1 still diverts all the flow, but is unable to get her full water right and water user number 2 again has no water to divert.†† From the environmental perspective, the stream no longer has flow to support riparian trees or meadows below the diversions and eventually, they disappear. Essentially, every year becomes a drought year downstream of the diversion.
† 1.0 cubic-foot per second is approximately 7.481gallons per second. Early miners were among the first to appropriate water in Nevada using “miner’s inch“. Today, Nevada has a legal definition that a “miner’s inch” is equal to 0.025 cubic-feet per second. †† Certain surface water allocations depend on “return flow” when not all the water is consumed irrigating a crop or water is returned to a stream from a sewage treatment facility. “Return flow” can then be diverted by another appropriator.
Water already claimed in rivers and springs.
The appropriation of surface water had negative effects on the rivers and streams and springs, because the original benefits of flow through the river’s environment were reduced. But the cyclic nature of water in the desert continued and when rivers and springs couldn’t keep up with the water users demand and reservoirs shrank, a new group of folks wanted water that they could depend on whether it rained or not. Groundwater pumping was a promise of unlimited supply – that unseen resource just beneath your feet. The promise was a false one and today we face a reckoning of over spending our water bank account on both fronts.
The “new” water: Groundwater.
Pumping from an aquifer can draw water from nearby streams and lakes. (Illustration: USGS)
Pumping significant amounts of groundwater from aquifers was really not possible during the time when most of the state’s surface water was allocated between the various industrial and agricultural users. Beginning in the mid-20th century, however, groundwater extraction with powerful pumps became more and more common. The Nevada State Engineer (NSE) allowed groundwater wells to be drilled for agriculture or other uses even in basins with fully appropriated rivers and streams and springs such as the Humboldt River and the Walker River and around Moapa’s springs. The NSE now admits, in many cases, the overallocation was known at the time, but the NSE didn’t expect that the people getting the permits would be economically successful (an erroneous assumption as it turned out!) or that they didn’t consider the negative effect groundwater pumping would have on rivers and springs. The damage to rivers and springs due to over pumping, however, is a matter of hydrology. The excuses for why it was allowed to continue for decades doesn’t change the negative outcome for river and spring flows and the consequences for the people dependent on them and to the fish and wildlife that can’t survive without them.
Pumping from two wells quickens the drawdown of groundwater. Many of Nevada’s desert valleys have dozens of approved pumping wells. In too many cases, there are also surface water users dependent on flows from rivers or streams or springs now seeing affects due to groundwater drawdown. (USGS Illustration)
In all groundwater pumping, groundwater levels decline by the very action of extracting water and bringing it to the surface. Essentially, a cone-shaped hole develops around the well. If pumping ceases soon after the pumping begins, the cone-shaped hole or depression slowly fills in and after a long enough period of time, it may get close to the original groundwater level, but that generally takes far longer to happen than the length of time the groundwater pumping occurred.
Over appropriating the groundwater.
Overallocated basins shown in green, yellow, and red. Note: “PY” is perennial yield, an estimate of the amount of water consumed by plants and surface water discharges (springs, creeks, and rivers) before the proposed development of groundwater.[ NSE office graphic]
Over the decades the Nevada State Engineer (NSE) has permitted groundwater users to over-appropriate as many as half of Nevada’s hydrographic basins in the state with the least amount of water. Theoretically, pumping is supposed to be “balanced” by drying out the surface and eliminating plants and water “discharges” (like springs) that use groundwater through evapotranspiration. (Eliminating all evapotranspiration to achieve this “balance” with groundwater pumping can result in a barren landscape increasing dust as well as damaging seeps, springs, and meadows dependent on groundwater.)
Pumping groundwater appears, at first, to be benign. When groundwater pumping begins, it removes water that may be a source of supply to rivers or springs, but the effect of pumping takes time to deplete the flow of a river or spring (see illustration above). The further away the river or spring is from the pumping, the longer it takes. Effects of the State’s overallocation of groundwater and the near complete allocation of surface water are now being felt with continually declining groundwater levels in as many as 50% of Nevada’s basins, but it is also affecting iconic rivers like the Humboldt – the largest river completely contained within the state’s borders. However, no river or stream is immune to the damage caused from pumping of groundwater (or the over allocation of surface water, for that matter). The extent of the pumping, leading to over pumping and continually dropping groundwater levels, harms the environment and leads to conflicts between water rights holders and to discord between and among rural and urban Nevadans.
Nevada water law is clear.
Before approving any water applications, Nevada water law (Title 48, NV Revised Statutes) requires the NSE to find that water is available at the source and it will not conflict with existing water rights. This requirement applies to both the allocation of surface water or groundwater. Nevertheless, the NSE has, in fact, allocated water far beyond the available supply. In the graphic above, those areas shown in “red” are 300% or greater over the available supply and the “yellow” and “green” areas are more than 200% or more than 110% over the available supply, respectively. It is easy to see why conflicts are escalating between and among users and why the environment in many areas suffers from a lack of water.
Nevada State Engineer now wants changes to the law.
The NSE now wants the legislature to change the law to allow the NSE to “deal with” the conflicts his water office has created over many decades (and in contradiction to the law’s provisions.) These changes are embodied in two pieces of legislation the NSE has brought to the 2019 Nevada Legislature – AB30 and AB51. Check out our next blog to see how these could affect our critically important rivers and streams and springs throughout Nevada.
Derby Dam (1905) diverts Truckee River Water away from Pyramid Lake. The project was the first of the new Bureau of Reclamation which was created by the Federal Government. The project still operates today and has shrunk Pyramid Lake by 80 feet and dried up Winnemucca Lake. (Historic photograph of the project’s completion: UNR Library Collection)